


[display-name-category]
[post_author]
The easiest thing in AdWords is to cut away the things that don’t work. I’ve been talking about this for years.“Streamlining” AdWords 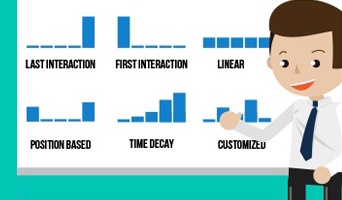 campaigns is not a hard task. It’s very easy to see what keywords/campaigns aren’t converting and pause them.
I often see that when this type of mindset is taken to AdWords optimization many will report improving metrics for 2-5 months:
-
Cost per conversion decreases
-
Return on investment increases
And everyone is happy, but then the inevitable happens. You start seeing fewer conversions and keywords that were previously profitable convert less and your cost per conversion increases. This isn’t a “one day to another” experience, but rather you reviewing the numbers one day and don’t understand how you ended up here.
A Quick Intro to Attribution Modeling
Before we go into today’s post, I want to give you a quick intro to attribution modeling as it’s laid out in Google Analytics:
Interaction
The word interaction refers to what method a visitor used to get to your website. An interaction can either be a traffic source (PPC, SEO, Email, etc.) or can be more granular like keywords or ad groups.
First Interaction
The first interaction is the first way that a visitor came to your website. If someone receives an email from you, goes to your website, then googles your product and gets to your website via an AdWords ad, then the first interaction is Email.
Last Interaction
The last interaction is the last way that a visitor came to your website before converting. This is the standard way of reporting transactions/conversions in Google Analytics.
Most people rely on using the last interaction as the method to report marketing metrics. It’s always been about the “last email” that made the customer convert. The magic keyword that finally convinced the customer to buy your product.
Only Measuring Last Interaction Takes You Down The Wrong Path
What is interesting to pay attention to in the screenshot below is how big of a difference there is in attribution when you compare first interaction vs. last interaction:
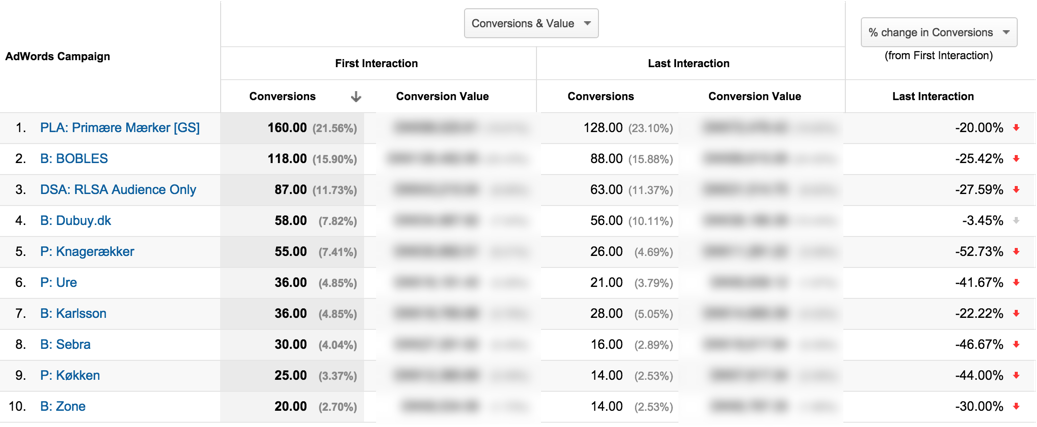
In almost all instances, we see a drop in conversions between 20% to 50% when we analyze first interaction vs. last interaction.
Note: First interaction is the number of conversions that are generated if we only review the first interaction that a customer had with our AdWords campaigns (in this case, within a 30-day timeframe).
The last interaction is the number of conversions that are generated if we only review the last interaction that a customer had.
Keywords Feed Other Keywords and Vice Versa
The chart listed above clearly shows that the buying funnel is not linear. We have all known this for a long time, but it’s easy to be drawn to the simplicity that is AdWords:
Somebody searches for keyword XYZ. He clicks your ad. He buys something on your website. All hail keyword XYZ for its amazing conversion capabilities.
Oh, but if it was just that simple. As the data showed previous in this blog post, then consumers search a little bit here, do a bit of social media there, perform a new search, and then react to a newsletter that spikes them to search directly for the brand name or maybe a coupon-related search.
If you don’t count the CPA/ROI goals of your keywords, you will have less direct conversions, but they will still be beneficial for your account. If you don’t, then you will be losing out on a lot of potentials, for this reason, you have to take into account that some keywords will feed the other keywords.
Not being present at the top, or middle, of the buying funnel keywords, will exclude your chances of being in consideration of when a consumer is making his final searches.
Are All Keywords Then Good Keywords?
This is where it starts getting a bit tricky. Because you’re not supposed to go all out and say that every single keyword will somehow contribute to your goal. Doing so is the fastest way to complacency and will quickly make the deciding powers in your company pull the plug on your advertising budget.
David Rodnitzky has contributed with a lot of knowledge to the PPC world, but the Lin-Rodnitzky Ratio is one of the best ones for helping out in this specific case. The ratio is intended to give your account a health-check by reviewing how many “chances” you’re taking with your account.
See David’s explanation here:
At PPC Associates, we’ve developed a simple way to calculate the health of an AdWords account, which we call the Lin-Rodnitzky Ratio(or L/R for short). The ratio is simply the CPA of all queries in your account with at least one conversion divided by the ratio of all queries in your account, regardless of whether a conversion occurred.
So, for example, if the CPA of 1+ conversion queries is $25 and the CPA of all queries is $75, the ratio is determined by dividing $75 by $25, for a score of 3.0. What we’ve generally found is that a well-optimized account has an L/R ratio of between 1.5 and 2.0.
Ratios over 2.0 tend to indicate excess fat in the account and ratios under 1.5 indicate an overly conservative account (usually too much focus on brand terms). You can learn more about the Lin-Rodnitzky Ratio here (pdf).
Even though the Lin-Rodnitzky Ratio was not originally intended to be used for calculating attribution modeling, then it’s almost the same thing.
One of the things the Lin-Rodnitzky Ratio calculates is whether you only focus on keywords that are at the end of the buying funnel. These keywords tend to convert better and thereby result in a lower cost per conversion. However, this also means that you’re missing out on the keywords from the beginning of the funnel.
Use Attribution Modeling in Google Analytics To Review Your Data
The attribution model comparison tool in Google Analytics is one of the first easy-to-use interfaces for advertisers. Google has tried various interfaces to show the information discussed in this blog post.
One of the first iterations was the rather confusing Search Funnel interface in Google AdWords. It’s still accessible and contains metrics like “Assisted Conversions”, “Impression-Assisted Conversions” and other names that left a lot to be researched.
With Google’s new attribution model comparison in Google Analytics you can much more easily analyze the data without being completely in the know:
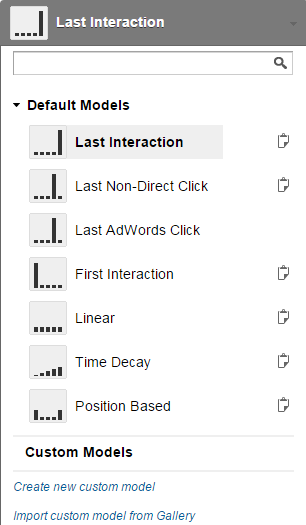
One of the best ways to move forward is to review the different attribution models. Try to compare one with the other, move from just looking at the different channels to reviewing campaigns – maybe even keywords.
Takeaways About The Way You Measure Your AdWords Campaigns
If there is one thing that I would like you to work away with from today’s blog post, then it’s this one thing. You shouldn’t automatically pause a keyword or decrease its bid because the CPA isn’t hitting your target.
I’m not saying you should let unprofitable keywords be active if they aren’t helping out, but if your campaign is within the overall target, you should reconsider lowering bids for the few keywords that lie outside your goal.
Review those keywords (or ad groups as they might be a better indication) for contributing early on in the buying funnel. They might just be producing a lot of interest for your company, but not result in many direct conversions.


